
Long story, short
Because you are using the pre-release of AL Language and you also have AL Test Runner installed. If you are using AL Test Runner then you probably want to switch to the release version of the AL Language extension for now.
Short story, made unnecessarily long
Microsoft are adding testing capability to the AL Language extension. It now discovers the tests in your project and puts them into the test explorer.
If you are using BC28 then the AL Language extension can connect to the server to run the tests (and maybe also debug them judging by the fact that option now shows up in the test explorer).
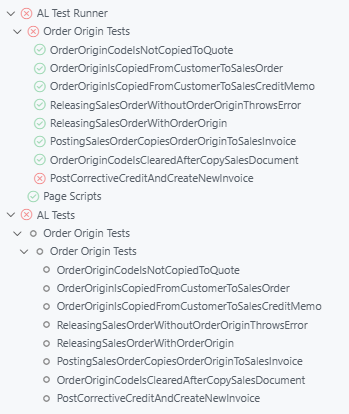
In the latest versions of AL Test Runner I have changed the name of the test controller to “AL Test Runner” to make it clearer what’s going on. “AL Tests” is the test tree created by the AL Language extension.
I’ve been fine working with both side-by-side for a few months, but recently I’ve had a problem where the test run never ends…
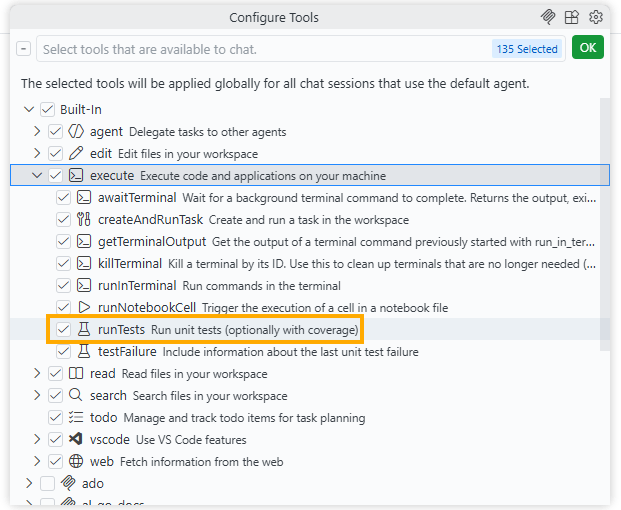
That’s especially annoying if you are using Copilot in VS Code and having it run tests while it is generating code. (If you’re not already doing that then you should definitely consider it, maybe I’ll blog about that at some point, in the meantime check out the #runTests Built-in tool that you can point your conversation/model at).
I think this is a bug in the AL Language extension when attempting to run tests against a pre-BC28 container i.e. a version of BC that doesn’t support the new testing execution. I’ve created a GitHub issue here: https://github.com/microsoft/AL/issues/8197
Unfortunately, if a test run for All Tests is started, either in the UI or by the AI model, then the AL Language test controller is triggered, which never finishes, which leaves the model waiting indefinitely for the test results (even after AL Test Runner has finished and retrieved the results).
What’s the future for AL Test Runner?
Now that Microsoft are adding more testing features what is going to happen to AL Test Runner?
For now, I’m going to maintain it as Microsoft’s version isn’t live and mine still has more features than Microsoft’s (code coverage, downloading performance profile, running page scripts). I expect Microsoft will add these features over time, I hope so.
At some point Microsoft’s extension will be feature-rich enough to retire AL Test Runner. I’ll keep you posted.


