Collectible Errors
In part 3 we had a look at the new platform feature, collectible errors. Long story short: it makes scenarios where you want to collect and display multiple errors together (e.g. checking journal lines) much easier to code and read, no messing around with if Codeunit.Run then, read the post if you’re interested.
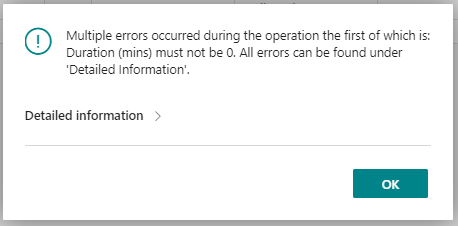
The only thing that let the team down was the horrible user interface to display the errors that have been collected. Shame, but at least the API has been designed with extensibility in mind and we can handle it ourselves. I’m using the same example as in the docs (but with a little added finesse).
GetCollectedErrors
There is a new global method, GetCollectedErrors. This will return a list containing the ErrorInfo objects which have been collected in the current transaction. That gives us all the detail that we need to display the errors in a user-friendlier way.
Show Errors Codeunit
I’ve created a new codeunit to accept the list of errors and show the standard Error Messages page. Of course, you can do whatever you want with this. Create a new table and page to display the errors if you like. For now, the Error Messages page does everything that I need.
See the commit with the changes here if you prefer: https://github.com/jimmymcp/error-message-mgt/commit/89b421db69656b3e2717a0b307975320c3d5ddef
codeunit 50103 "Show Errors"
{
    SingleInstance = true;

    procedure ShowErrors(Errors: List of [ErrorInfo]; Context: Variant)
    var
        TempErrorMsg: Record "Error Message" temporary;
        DataTypeMgt: Codeunit "Data Type Management";
        ErrorInfo: ErrorInfo;
        RecRef: RecordRef;
    begin
        if Errors.Count() = 0 then
            exit;

        foreach ErrorInfo in Errors do begin
            TempErrorMsg.LogDetailedMessage(ErrorInfo.RecordId, ErrorInfo.FieldNo, TempErrorMsg."Message Type"::Error, ErrorInfo.Message, ErrorInfo.DetailedMessage, '');
            if DataTypeMgt.GetRecordRef(Context, RecRef) then
                TempErrorMsg.Validate("Context Record ID", RecRef.RecordId());
            TempErrorMsg.SetErrorCallStack(ErrorInfo.Callstack);
            TempErrorMsg.Modify();
        end;

        Page.Run(Page::"Error Messages", TempErrorMsg);
        Error('');
    end;
}
A couple of notes on the above:
- There is a SetContext method on the error message record which I’m not using. For reasons I’m not clear about that method sets the context fields on a global variable in the Error Message table, not on the record instance itself
- Calling the Log methods on the Error Messages table captures the current callstack*, I’m overwriting that with the callstack on the Error Info object
- The Error(”); on the final line ensures that code execution is stopped and the transaction rolled back. An error like this (outside of If Codeunit.Run then) cannot be collected
I’ve added the last line to the CheckLines method (the method which is collecting the errors):
[ErrorBehavior(ErrorBehavior::Collect)]
local procedure CheckLines(VideoCallBatch: Record "Video Call Batch")
var
VideoJnlLine: Record "Video Journal Line";
ShowErrors: Codeunit "Show Errors";
begin
//check lines code
ShowErrors.ShowErrors(GetCollectedErrors(), VideoCallBatch.RecordId());
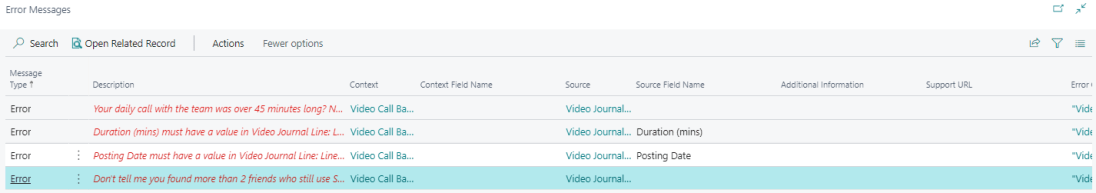
end;The result is something like this. The Error Messages page does the rest, drilling down to show the callstack, adding an action to open the related record, displaying the name of the field name related to the error.

Check the docs for more info. The error info API includes IsCollectingErrors(), HasCollectedErrors() and ClearCollectedErrors().
*incidentally, with an ugly hack like this (https://tecman.typepad.com/software_answers/2016/07/context-of-events-in-microsoft-dynamics-nav.html) 😉 I’m not sure whether to be pleased that I wasn’t missing a better way to do it back then or disappointed that there still isn’t a better way to do it 6 years later.**
**Actually, maybe this could be improved with a collectible error?***