Additional Details about Extension Settings in Business Central 25.0

Extension Settings

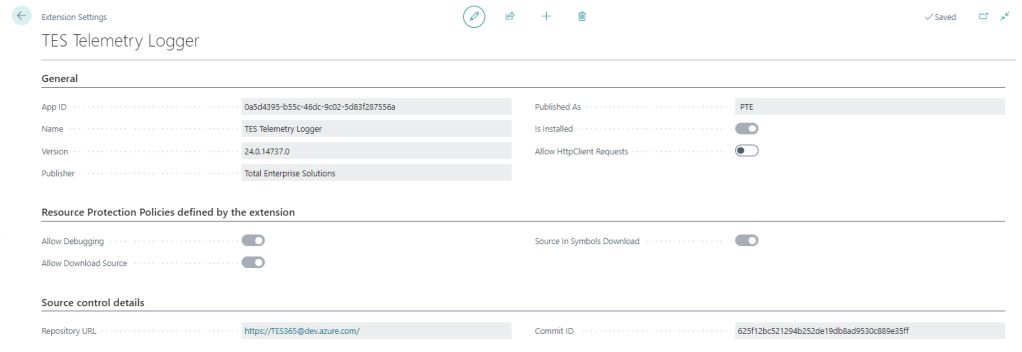
For a long time the only thing additional data you could see on the Extension Settings page was whether to allow Http calls from this extension (the Allow HttpClient Requests checkbox). This page has got some love in BC25.

That setting is still the only thing that you can control, but now you can also see:

Resource Protection Policies

Corresponding to resource exposure policies in app.json (maybe “exposure” sounded a little risqué for the user interface). This indicates whether you can debug, download the source code and whether the source is included when you download the symbols.

That might be useful to know before you create a project to download the symbols and attempt to debug something.

Interestingly, extensions which don’t expose their source code get the red No of shame in the Extension Management list.

Source Control Details

Includes the URL of the repository and the commit hash that the extension was created from. That’s cool – you can link straight from the Extension Settings page to the repo in DevOps / GitHub / wherever your source is. That’s a nice feature either for your own extensions or open source extensions that you are using.

It may be that each time you build an app that you already give it an unambiguous, unique version number (we include the DevOps unique build id in the extension version) but the commit hash is nice to see as well.

How Does it Know?

Where does that information come from? It is included in the NaxManifest file, extract the .app file with 7-Zip and take a look.

<ResourceExposurePolicy AllowDebugging="true" AllowDownloadingSource="true" IncludeSourceInSymbolFile="true" ApplyToDevExtension="false"/>
<KeyVaultUrls/>
<Source RepositoryUrl="https://TES365@dev.azure.com/..." Commit="625f12bc521294b252de19db8ad9530c889e35ff"/>
<Build Timestamp="2024-09-10T12:49:40.2694758Z" CompilerVersion="13.1.16.16524"/>
<AlternateIds/>

How Does That Info Get Populated?

When the app is compiled by alc.exe there are additional switches to set this information. These are some of the switches that you can set when compiling the app.

These switches are not set when you compile the app in VS Code (crack the app file open with 7-Zip and check), but you can set them during the compilation step of your build. If you are using DevOps pipelines you can make use of these built-in variables Build.SourceVersion and Build.Repository.Uri to get the correct values.

&'$(alcPath)' /project:"$(projectPath)" /sourcecommit:"$(Build.SourceVersion)" /sourcerepositoryurl:"$(Build.Repository.Uri)" ... (truncated)

That’s if you roll your own build pipelines. If you use some other tooling (AL-Go for GitHub, ALOps etc.) then the compilation step will be in their code. They may have already implemented this, I don’t know.

Side note: Microsoft want to push us to use 3rd party tooling rather than making our own (e.g. I watched this podcast with Freddy the other day) but personally I still see enough value in having control over the whole DevOps process to justify the small amount of time I spend maintaining and improving it. I’m open to changing that stance one day, but not today.

Testing Compatibility Between Runtime and Application Version in Business Central Builds

Background

Recently I got stung by this. As a rule we keep the application version in app.json low (maybe one or two versions behind the latest) so that it can be installed into older versions of Business Central. Of course this is a balance – we don’t want to have to support lots of prior versions and old functionality which is becoming obsolete (like the Invoice Posting Buffer redesign, or the new pricing experience which has been available but not enabled by default for years). Having to support multiple Business Central features which may or may not be enabled is not fun.

On the other hand, Microsoft are considering increasing the length of the upgrade window so it is more likely that we are going to want to install the latest versions of our apps into customers who are not on the latest version of Business Central.

Runtime Versions

But that wasn’t really the point of the post. The point is, there are effectively two properties in app.json which define the minimum version of Business Central required by your app.

  • application: the obvious one. We mostly have this set a major prior to the latest release unless there are specific reasons to require the latest
  • runtime: the version of the AL runtime that you are using in the app. When new features are added to the AL language (like ternary operators – who knew a question mark could provoke such passionate arguments?), as, is, and this keywords, or multiple extensions of the same object in the same project

If you want to use cool new features of the language (and we do, right? Us devs love this stuff) then you need to increase the runtime version in app.json. But, you need to be aware that you are effectively also increasing the minimum version required by your app. Even if you aren’t using anything new in the base and system applications. This is the table of currently available runtime versions: https://learn.microsoft.com/en-us/dynamics365/business-central/dev-itpro/developer/devenv-choosing-runtime#currently-available-runtime-versions

Pipelines

I didn’t want to get caught out by this again so I added a step into our pipeline to catch it. The rule I’ve gone with is, the application version must be at least 11 major version numbers higher than the runtime version. If it isn’t then fail the build. In that case we should either make a conscious decision to raise the application version or else find a way to write the code that doesn’t require raising the runtime version. Either way, we should make a decision, not sleep walk into raising our required application version.

Why 11? This is because runtime 1.0 was released with Business Central 12.0. Each subsequent major release of Business Central has come with a new major release of the runtime (with a handful of runtime releases with minor BC releases thrown in for good measure).

The step is pretty simple ($appJsonPath is a variable which has been set earlier in the pipeline).

steps:
  - pwsh: |
      $appJson = Get-Content $(appJsonPath) -Raw | ConvertFrom-Json
      $runtimeVersion = [Version]::Parse($appJson.runtime)
      $applicationVersion = [Version]::Parse($appJson.application)

      if ($applicationVersion -lt [version]::new($runtimeVersion.Major + 11, $runtimeVersion.Minor)) {
        Write-Host -ForegroundColor Red "##vso[task.logissue type=error;]Runtime version ($runtimeVersion) is not compatible with application version ($applicationVersion)."
        throw "Runtime version ($runtimeVersion) is not compatible with application version ($applicationVersion)."
      }
    displayName: Test runtime version

Code Coverage Updates in VS Code with AL Test Runner

Intro

For a while now AL Test Runner has been able to download the code coverage details after running your tests, output a summary of the objects that were hit with some stats and then highlight the lines which were hit in the previous test run or the last time you ran all the tests. More in the docs.

Recently, VS Code has added an API for test extensions to feed data into and some UI to show the coverage. It’s pretty cool.

Test Coverage

The first thing you’ll notice is this “Test Coverage” panel which is displayed after the tests have run. It displays a tree of the ojbects which have been hit by the run and the percentage coverage (in statement coverage terms).

If you click on a file in the tree it will open the file in the editor and you will see lines which were hit highlighted in the gutter.

In fact, these highlights will continue to be shown as you navigate around your source code. I’m leaving the “Code Coverage: Off/Previous/All” item in the status bar as this highlights each whole line and is much easier to see if you want to zoom out and get an impression of coverage of the whole file.

Coverage from Previous Runs

Coverage from previous test runs is stored and can be accessed from the Test Results pane (usually shown at the bottom of the screen). It might be useful to switch between test coverage results for test runs to see how to coverage % has changed over time (with the usual caveat about not using code coverage as a target).

The decorations in the gutter to indicate which lines have been covered in the current file are only shown when the latest test coverage is being displayed. That makes sense because the code coverage detail is all based on line numbers. Once you’ve made some changes to a file those line numbers are obsolete.

Performance Profiling Tests with AL Test Runner

This is a feature that has been in AL Test Runner for a months now but I haven’t got round to blogging about it. I haven’t done much blogging or work on AL Test Runner for a while now. I started a new job at the start of the year and had more important stuff keeping me occupied, but Johannes (https://github.com/jwikman) has prompted me into some action with some contributions recently – thanks very much for that 🥳

Scenario

My original scenario was that we had some poorly performing code. Complex code. Complex code I hadn’t been involved with much before. Complex code that would be easy for me to break functionally, while trying to improve the performance.

My first task was to surround the code with some integration tests. I find this an effective way to learn some existing code. You have to learn how to construct the GIVENs – what is the data structure and what setup is required for each test? It also gives you an easy way to step through the code and see what’s going on when certain processes are run. Crucially it also gave me some confidence that I wasn’t completely screwing up the app that I was working on while I was changing it.

Comparing Performance

OK, so I’ve got some tests to validate the functional behaviour before and after my changes, but what about performance? We have the Performance Toolkit, but I think that is less about the performance of a single process and more about concurrency. The obvious choice is to use the Performance Profiler.

I wanted to leave the existing code paths intact and just use a setup field as a rudimentary feature flag to switch between the old code and the new code. But, I didn’t want to be opening the client to run the performance profiler page or initialize and download snapshot profiles in between each test. I wondered if it was possible to could automate capturing a profile and downloading it to the workspace somehow.

It was 🙂

Setup

There is a new setting “Enable Performance Profiler” which defaults to true. This uses some new functions in the Test Runner Service app. With each test run the performance profile is captured and downloaded to the .altestrunner folder in your test project.

This should all be handled automatically. The Test Runner Service app should be downloaded when required and the serviceUrl in the config file set automatically. Check the docs for the required setup if not though.

Use

There is a new icon in the status bar which will open the performance profile viewer with the latest trace.

With this I could run two tests with the old and the new and compare the results side by side. If you want to do that just take a copy of the first trace file as it will be overwritten by the second test.

The trace, of course, has other benefits too. It is much easier to see the whole callstack and use the links on the right hand side to jump straight into the code. This also gives the potential for other features. I could maybe do something that allows you to choose two tests to run and download separate traces for them all in one action? Or read through the trace file to update the test coverage map? Let me know whether either of those sounds interesting or if you have other ideas or issues.

Using the Dynamic Data Type in KQL

Intro

Lately I’ve been working more with telemetry, Application Insights, the excellent Power BI report and samples from Microsoft and writing a little KQL. Back in the days when you actually knew where your SQL server was I used to write a lot of ad-hoc SQL for analysis or troubleshooting so getting into KQL has been nice.

KQL sort of looks like SQL…but with the SELECT and FROM clauses switched round…and use project instead of SELECT…and use join kind=leftouter instead of LEFT JOIN…and DON’T WRITE EVERYTHING IN CAPS.

At least WHERE is still the same (but stop shouting and use where instead of WHERE).

If you want to get into writing your own KQL I’d recommend Kusto Explorer and this post got me started with creating the connection to Application Insights.

Variables

Like with SQL you can create your own variables for use later in your script. So you probably use SET or DECLARE then? No, use let like in JavaScript.

let tenantId = "c042cd54-77a9-4b96-aa0b-fc43bd0161c7";

Then use that variable in your script.

let tenantId = "c042cd54-77a9-4b96-aa0b-fc43bd0161c7";
traces |
    where customDimensions.tenantId == tenantId

Notice:

  • the semicolon between the statements, as in JavaScript (or not…digression)
  • no blank line between the statements, otherwise they are interpreted as separate scripts and your where line will break
  • the double equals – remember, like JavaScript, not T-SQL
  • the table (traces) is piped to the where, like a scripting language

Dynamic Data Type

KQL supports a bunch of data types with built-in functions to manipulate them and convert between them but it also has a dynamic data type which is a generic container to hold any of the other types – like a variant in AL.

I’ve found this useful for creating a dictionary of values that I want to lookup later in the script. I’ve been querying the signals for scheduled tasks and job queue entries. These signals include the object ids that were executed, but not their names.

We can use the dynamic function to create a dynamic value and parse some JSON to create a dictionary of object id and object name. Later in the script we can retrieve the object name with square brackets.

let objectNames = dynamic({"50100": "Improbability Drive Calcs.", "50101": "Restart Flux Capacitor"});
traces
| where
...
| project
...
objectName = objectNames[tostring(customDimensions.alJobQueueObjectId)]

Notice:

  • You can name the column in the projected output with columnName =
  • Use tostring() to cast the dynamic value in customDimensions to a string

DataTable

Creating a dictionary was enough for me because I’m mostly dealing with codeunits and I don’t care if there are pages or tables with the same id. If you do care then you could create a table instead with the datatable operator. Like this:

let objectNames = datatable(objectType: string, objectId: int, objectName: string)[
    "Table", 18, "Customer",
    "Codeunit", 80, "Sales-Post"
];
objectNames
| where objectType == "Table" and objectId == 18
| project objectName

Resources